Introducing The Levey-Jennings Chart
Quality control is an integral part of quality management in the clinical laboratory. The L-J chart for short, is a useful tool in monitoring controls and ensuring they within desired limits.
But What are Quality Controls?
Controls are known concentrations of analytes that helps us know if a test system is working as accurately as intended. Lets use an example of blood sugar. The manufacturer of the chemistry analyser will supply solutions with known concentrations of glucose. These ideally are lower, within and higher than reference range.
Every time we run controls on our testing system, we expect them to approximate what the manufacturer has indicated. If they vary too much, then we say the system is out of control. In such a scenario, we would not analyse patient samples as we have no guarantee the results are accurate and reliable. Later, we will discuss how we troubleshoot possible issues and corrective measures.
Enter the Levey-Jennings Chart
Just because a control run does match the expected figure doesn’t necessarily mean the system is out of control. Test systems have a natural variation that cannot be eliminated entirely. That’s why we measure the control several times and see how much each vary and more importantly the trend of the variation.
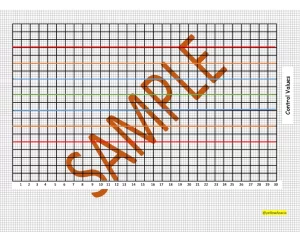
The L-J Chart is simply a graph paper that allows us to plot the measurements of controls against the mean and between 1 to 3 standard deviations SD. That way we get a visual guide on how our controls are behaving.
A typical L-J Chart developed inhouse at labtestzote.com is shown below.

To ensure effective monitoring and interpretation of quality control (QC) data, it is crucial to compare the values of each positive control with the established mean and standard deviations of the control sample.
Constructing L-J Charts
Once controls are run, daily control values are plotted daily. The mean value and the values of ±1, 2, and 3 standard deviations (SDs) are determined as well.
Calculating 2 SDs involves multiplying the SD by 2 and adding or subtracting each result from the mean. Calculating 3 SDs involves multiplying the SD by 3 and adding or subtracting each result from the mean.
The controls will naturally be distributed, approximately 68.3% of values will fall within +1 SD, 95.5% within ±2 SD, and 99.7% within +3 SD of the mean.
To create Levey-Jennings charts for daily laboratory use, the initial step is to calculate the mean and SD using a set of 20 control values. Once the appropriate control value range is established, graphically representing this range becomes highly beneficial for daily monitoring, with Levey-Jennings charts being the preferred tool for this purpose.
On the chart, control values are plotted on the Y-axis, while the date/time is plotted on the X-axis. The chart should include the mean value and one, two, and three standard deviations above and below the mean for easy interpretation.
Even if a control value falls within 2 SD, it can still be a cause for concern. Levey-Jennings charts assist in distinguishing between normal variation and systematic errors.
Validating an assay begins by ensuring that the kit or assay is not expired and that the kit/assay controls meet the specified limits.
The Westgard Rules
Additional rules, such as the Westgard rules, can be applied to evaluate the validity of in-house control (IHC) sample results and determine whether they can be reported or need repetition.
For improved efficiency and accuracy, implementing a system with two or three controls for each run is recommended. In such cases, additional rules can be utilized to avoid rejecting acceptable runs. These rules were introduced to laboratory quality control by James Westgard, a clinical chemist. The Westgard multirule system involves running two controls with different target values for each set of examinations, creating a Levey-Jennings chart for each control, and applying the rules.
Using three controls with each run provides even greater assurance of test run accuracy. It is advisable to select values representing low, normal, and high ranges when employing three controls. Westgard rules for a system with three controls are also available.
Westgard rules define specific performance limits for a particular assay and can detect both random and systematic errors. If any of the following conditions are met, thorough investigation and possible repetition of the assay run are necessary:
- The IHC shows three consecutive values more than one standard deviation above or below the mean IHC.
- The IHC shows two consecutive values more than two standard deviations above or below the mean IHC.
- The IHC shows one value more than three standard deviations above or below the mean IHC.
Great, Now Give me My L-J Chart🥵!
So, we have gone through what the L-J charts are, what they are used for and by now, im sure you want one.
Out of necessity, we developed on and we are offering it for absolutely free. All we ask is consider getting on our awesome newsletter by clicking here. You can go ahead and download Levey-Jennings Chart.
Feel free to reach out if you have any questions; I’m here to help.
[custom-related-posts title=”Related Posts” none_text=”None found” order_by=”title” order=”ASC”]
